Regional monitoring
Schedule HTTP and TLS checks across enrolled probes, or run a check on demand when operators need fresh evidence.

// Siteorium by DEVECTUS
Siteorium is a multi-tenant website monitoring and incident escalation platform. Regional probes collect evidence, deterministic rules confirm incidents, and policy controls who is contacted by email, SMS or voice.
// Operational clarity
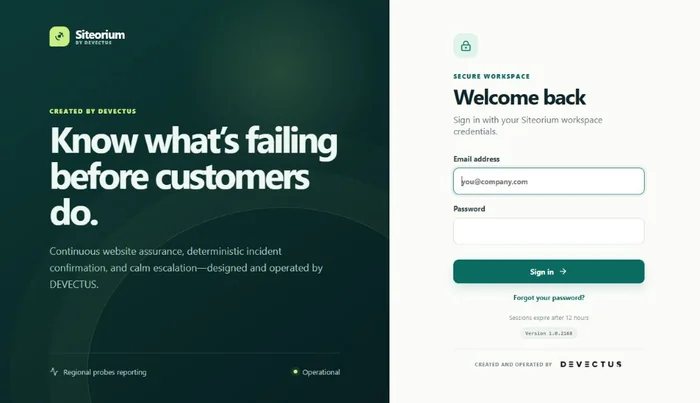
Siteorium connects website checks, probe health, incidents, escalation policy, reporting and audit history without mixing one customer's operations with another's.
Illustrative interface summary. Status data is fictional.
Schedule HTTP and TLS checks across enrolled probes, or run a check on demand when operators need fresh evidence.
Merchant websites, roles, checks, incidents and reports remain scoped to their tenant, backed by PostgreSQL row-level security.
A repeatable state model separates a suspected failure from a confirmed incident and prevents duplicate alert storms.
Acknowledge events, add notes, review a complete evidence timeline and calculate downtime when service recovers.
Severity and routing policy decide whether configured email, SMS or voice channels should be used.
Operational reports, maintenance windows and audit records make decisions and changes easier to review.
// Signal without noise
Siteorium uses a deterministic state model per check and region, so transient failures do not immediately become noisy incidents.
The first regional failure records evidence and marks the check as suspected.
A second consecutive failure opens one incident for that check and region.
Later failures append evidence to the same incident instead of creating an alert storm.
A successful result resolves the event and records calculated downtime.
// Built for operators
Platform roles manage the service globally while merchant roles stay tenant-scoped. Operators can inspect probe evidence, acknowledge an incident, add notes, manage escalation and review billable work without losing the history behind a decision.
Illustrative incident using fictional data.
// Siteorium + Donova
Siteorium remains the operational system of record. When voice escalation is enabled, it sends bounded incident context through a validated Donova connection so the responder can be notified and directed back to Siteorium.
Voice context is limited to the incident reference, severity, website name, detection time and operational reason. Tokens are encrypted at rest and only a fingerprint is shown in the platform.
Validated routes match the sender country. Siteorium does not fall across countries, and a disabled or invalid configured route fails closed instead of silently bypassing policy.
// Technical foundation
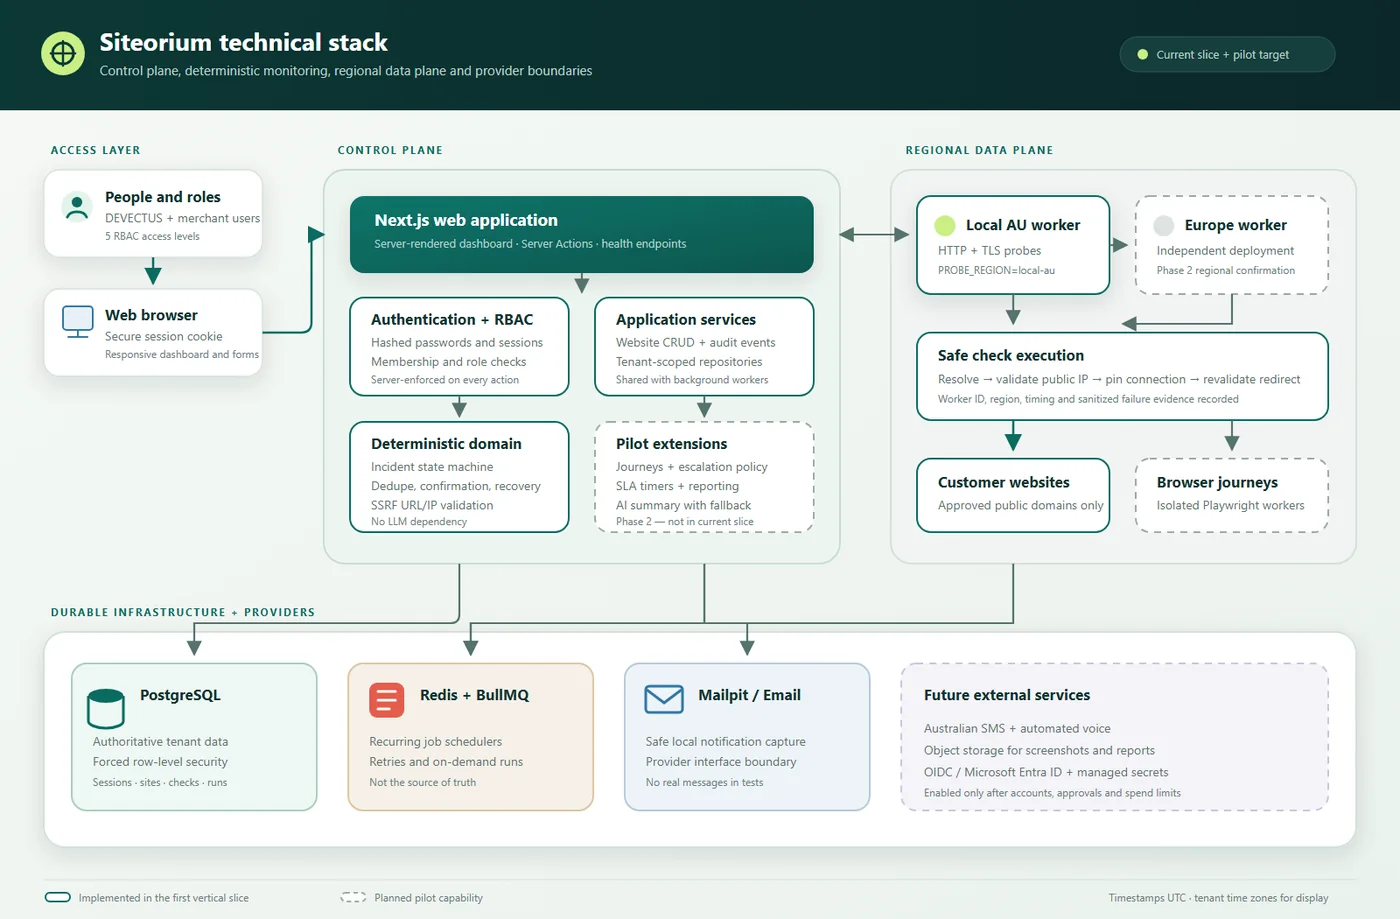
The control plane is a TypeScript and Next.js application backed by PostgreSQL with row-level security. Redis and BullMQ coordinate work, while regional probes communicate over outbound HTTPS and submit authenticated, idempotent results.
// See the platform
Open Siteorium or talk with DEVECTUS about a managed monitoring setup for your websites and operational teams.